1

pythonのmatplotlibの凡例と補助線についていくつか質問があります

質問1 色ごとに凡例を作るにはどうすればよいですか。

質問2 補助線の間隔をx,y軸に対して1刻みに記すにはどうすればよいですか。

質問3 目盛りの数字の間隔はx,y軸についてそれぞれ50刻み、10刻みで記していますが、x,y軸についてそれぞれ10刻み、5刻みに変更するにはどうすればよいですか。

以上の3つの質問があります。

   
data.txt

0   0    0.016   19.833
1   0   19.834   52.805
2   0   52.806   84.005
5   0   84.012  107.305
8   0  107.315  128.998
10  0  129.005  138.956
11  0  138.961  145.587
13  0  145.594  163.863
15  0  163.872  192.118
16  0  192.127  193.787
17  0  193.796  197.106
20  0  236.099  246.223
25  1   31.096   56.180
27  1   58.097   64.857
28  1   64.858   66.494
29  1   66.496   89.908
31  1   89.918  111.606
34  1  129.007  137.371
35  1  137.372  145.727
39  1  176.097  209.461
42  1  209.476  226.207
44  1  226.217  259.317
46  1  259.329  282.488
47  1  282.493  298.905
    

プログラムは以下のとおりです。

#! /usr/bin/env python
# -*- coding: shift_jis -*-
import numpy as np
import matplotlib.pyplot as plt
y, c, x1, x2 = np.loadtxt('data.txt', unpack=True)
color_mapper = np.vectorize(lambda x: {0: 'red', 1: 'blue'}.get(x))

plt.hlines(y, x1, x2, colors=color_mapper(c))
plt.margins(0.1)

plt.grid()
plt.show()
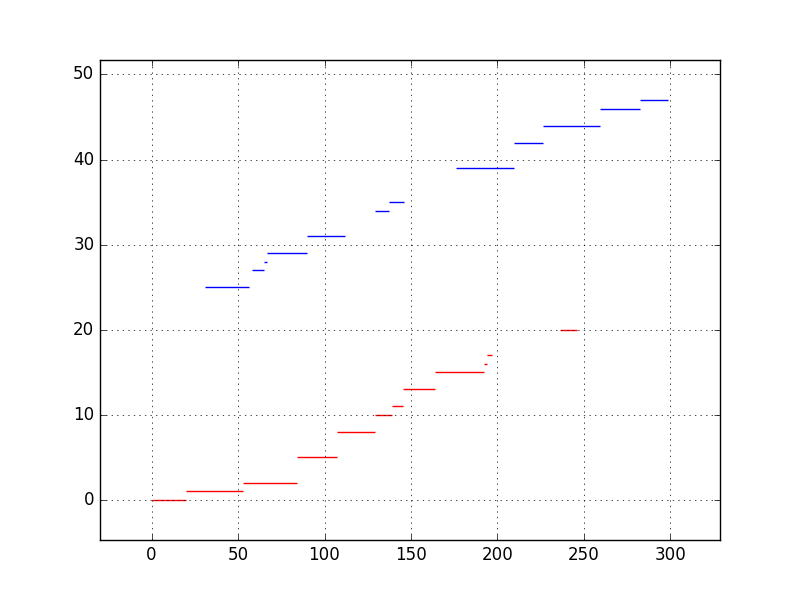
出力グラフ
現在のグラフは目盛りの数字の間隔と補助線の間隔が一緒になってしまっています。
よろしくお願いします。

1
  • matplotlibの凡例の機能に頼るなら、colorsを使わずに二つのプロットに分けて、それぞれlabelを指定し、plt.legend([plt_1, plt_2])とするしかない気がします。 Commented 2015年12月1日 9:09

1 件の回答 1

1

色ごとにデータを分けてプロットして、それぞれにラベルを付与します。

#! /usr/bin/env python
# -*- coding: utf-8 -*-

import numpy as np
import matplotlib.pyplot as plt
import matplotlib.ticker as tick

attributes = {
    0: {
      'color': 'red',
      'label': 'label for red'
    },
    1: {
      'color': 'blue',
      'label': 'label for blue'
    }
  }

y, c, x1, x2 = np.loadtxt('data.txt', unpack=True)

for ckey in attributes.keys():
  c_arr = [i for i in range(len(x1)) if c[i] == ckey]
  yy, x_1, x_2 = [y[i] for i in c_arr], [x1[i] for i in c_arr], [x2[i] for i in c_arr]
  plt.hlines(yy, x_1, x_2, colors=attributes[ckey].get('color'), label=attributes[ckey].get('label'))

plt.margins(0.1)
plt.legend(loc = 'upper left')

## 質問3 x,y軸についてそれぞれ10刻み、5刻みに変更するにはどうすればよいですか。
plt.gca().xaxis.set_major_locator(tick.MultipleLocator(10))
plt.gca().yaxis.set_major_locator(tick.MultipleLocator(5))

## 質問2 補助線の間隔をx,y軸に対して1刻みに記すにはどうすればよいですか。
plt.gca().xaxis.set_minor_locator(tick.MultipleLocator(1))
plt.gca().yaxis.set_minor_locator(tick.MultipleLocator(1))
plt.grid(which='both')

plt.show()
1
  • 素早い解答ありがとうございます。解決できました。
    – jun
    Commented 2015年12月1日 9:39

この質問に回答するには、ログインする必要があります。

求めていた回答ではありませんか? のタグが付いた他の質問を参照する。