学習データとして、複数の整数をリストに入れて、用意したとします。学習データはいくら大きくても問題ありません。
例1:
a = [1, 2, 3, 4, 5]
例2:
a = [1, 2, 3, 4, 5, 2, 3, 4, 5, 3, 4, 5, 4, 5, 5]
このリストに入っている整数に従って(つまり、それぞれの数字の個数に出る確率が比例する)乱数を1つ生成する最も簡単な方法は、random.choiceを使うことです。
from random import choice

a = [1, 2, 3, 4, 5, 2, 3, 4, 5, 3, 4, 5, 4, 5, 5]

print(choice(a))
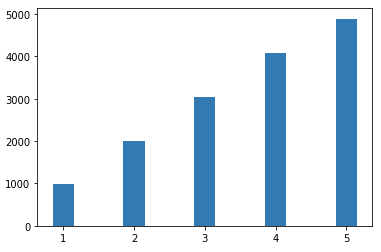
ヒストグラムを描いてみると、実際に偏っていることが確認できます。
from random import choice
import matplotlib.pyplot as plt
import numpy as np

a = [1, 2, 3, 4, 5, 2, 3, 4, 5, 3, 4, 5, 4, 5, 5]

numbers = [choice(a) for _ in range(15000)]

plt.hist(numbers, bins=np.arange(min(a), max(a) + 2) - 0.5, rwidth=0.3)
plt.show()

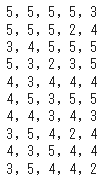
あとは、これを5個まとめてカンマ区切りで出力すればよいことになります。例えば、次のプログラムでは 5個/回 × 10回 = 計50個 の乱数を出力しています。
from random import choice

a = [1, 2, 3, 4, 5, 2, 3, 4, 5, 3, 4, 5, 4, 5, 5]

for _ in range(10):
    numbers = [choice(a) for _ in range(5)]
    print(', '.join(str(n) for n in numbers))


