user9156によって削除が取り消された投稿
削除済み投稿 (投票者: user9156)
本文に 27 文字追加
ソース リンク
user9156
user9156

※ スクリーンショットを載せます

以下の様に print() で囲んで実行します。

example4-5.r

##pdf("figure4-2.pdf")
         :
print(ggplot(data = df) + scale_shape_manual(name="Type", values=c(2,3,4)) + 
  geom_smooth(aes(x = population, y = mean)) +
  geom_point(aes(x  = population, y = mean, shape = "mean")) +
  geom_smooth(aes(x = population, y = median)) +
  geom_point(aes(x  = population, y = median, shape = "median")) +  
  geom_smooth(aes(x = population, y = max)) +
  geom_point(aes(x  = population, y = max, shape = "max")) +
  scale_y_continuous("queue size") +
  scale_x_continuous("population"))

もしくは、ggplot の結果を変数にバインドして print()plot() を実行します。

plt <- ggplot(data = df) + ...
print(plt) ## or plot(plt)

Screenshot
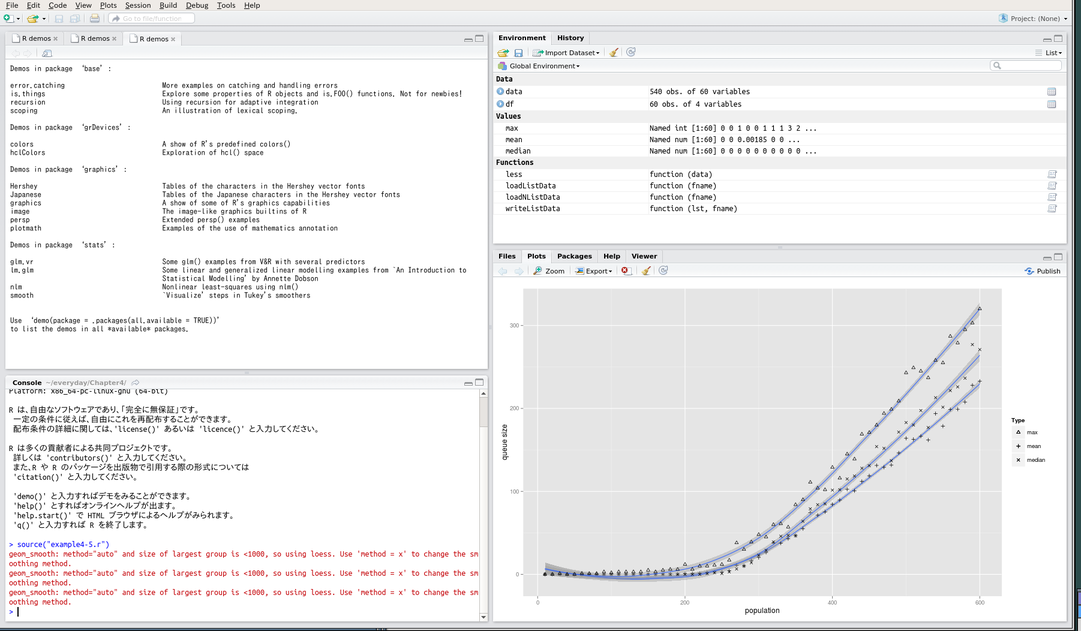
screenshot

※ スクリーンショットを載せます

以下の様に print() で囲んで実行します。

example4-5.r

##pdf("figure4-2.pdf")
         :
print(ggplot(data = df) + scale_shape_manual(name="Type", values=c(2,3,4)) + 
  geom_smooth(aes(x = population, y = mean)) +
  geom_point(aes(x  = population, y = mean, shape = "mean")) +
  geom_smooth(aes(x = population, y = median)) +
  geom_point(aes(x  = population, y = median, shape = "median")) +  
  geom_smooth(aes(x = population, y = max)) +
  geom_point(aes(x  = population, y = max, shape = "max")) +
  scale_y_continuous("queue size") +
  scale_x_continuous("population"))

もしくは、ggplot の結果を変数にバインドして print() を実行します。

plt <- ggplot(data = df) + ...
print(plt)

Screenshot

screenshot

※ スクリーンショットを載せます

以下の様に print() で囲んで実行します。

example4-5.r

##pdf("figure4-2.pdf")
         :
print(ggplot(data = df) + scale_shape_manual(name="Type", values=c(2,3,4)) + 
  geom_smooth(aes(x = population, y = mean)) +
  geom_point(aes(x  = population, y = mean, shape = "mean")) +
  geom_smooth(aes(x = population, y = median)) +
  geom_point(aes(x  = population, y = median, shape = "median")) +  
  geom_smooth(aes(x = population, y = max)) +
  geom_point(aes(x  = population, y = max, shape = "max")) +
  scale_y_continuous("queue size") +
  scale_x_continuous("population"))

もしくは、ggplot の結果を変数にバインドして print()plot() を実行します。

plt <- ggplot(data = df) + ...
print(plt) ## or plot(plt)

Screenshot

screenshot

本文から 2 文字削除
ソース リンク
user9156
user9156

※ スクリーンショットを載せます

以下の様に print() で囲んで実行します。

example4-5.r

##pdf("figure4-2.pdf")
         :
print(ggplot(data = df) + scale_shape_manual(name="Type", values=c(2,3,4)) + 
  geom_smooth(aes(x = population, y = mean)) +
  geom_point(aes(x  = population, y = mean, shape = "mean")) +
  geom_smooth(aes(x = population, y = median)) +
  geom_point(aes(x  = population, y = median, shape = "median")) +  
  geom_smooth(aes(x = population, y = max)) +
  geom_point(aes(x  = population, y = max, shape = "max")) +
  scale_y_continuous("queue size") +
  scale_x_continuous("population"))

もしくは、ggplot の結果を変数にバインドして print() を実行します。

plotplt <- ggplot(data = df) + ...
print(plotplt)

Screenshot

screenshot

※ スクリーンショットを載せます

以下の様に print() で囲んで実行します。

example4-5.r

##pdf("figure4-2.pdf")
         :
print(ggplot(data = df) + scale_shape_manual(name="Type", values=c(2,3,4)) + 
  geom_smooth(aes(x = population, y = mean)) +
  geom_point(aes(x  = population, y = mean, shape = "mean")) +
  geom_smooth(aes(x = population, y = median)) +
  geom_point(aes(x  = population, y = median, shape = "median")) +  
  geom_smooth(aes(x = population, y = max)) +
  geom_point(aes(x  = population, y = max, shape = "max")) +
  scale_y_continuous("queue size") +
  scale_x_continuous("population"))

もしくは、ggplot の結果を変数にバインドして print() を実行します。

plot <- ggplot(data = df) + ...
print(plot)

Screenshot

screenshot

※ スクリーンショットを載せます

以下の様に print() で囲んで実行します。

example4-5.r

##pdf("figure4-2.pdf")
         :
print(ggplot(data = df) + scale_shape_manual(name="Type", values=c(2,3,4)) + 
  geom_smooth(aes(x = population, y = mean)) +
  geom_point(aes(x  = population, y = mean, shape = "mean")) +
  geom_smooth(aes(x = population, y = median)) +
  geom_point(aes(x  = population, y = median, shape = "median")) +  
  geom_smooth(aes(x = population, y = max)) +
  geom_point(aes(x  = population, y = max, shape = "max")) +
  scale_y_continuous("queue size") +
  scale_x_continuous("population"))

もしくは、ggplot の結果を変数にバインドして print() を実行します。

plt <- ggplot(data = df) + ...
print(plt)

Screenshot

screenshot

本文に 134 文字追加
ソース リンク
user9156
user9156

※ スクリーンショットを載せます

以下の様に print() で囲んで実行します。

example4-5.r

##pdf("figure4-2.pdf")
         :
print(ggplot(data = df) + scale_shape_manual(name="Type", values=c(2,3,4)) + 
  geom_smooth(aes(x = population, y = mean)) +
  geom_point(aes(x  = population, y = mean, shape = "mean")) +
  geom_smooth(aes(x = population, y = median)) +
  geom_point(aes(x  = population, y = median, shape = "median")) +  
  geom_smooth(aes(x = population, y = max)) +
  geom_point(aes(x  = population, y = max, shape = "max")) +
  scale_y_continuous("queue size") +
  scale_x_continuous("population"))

もしくは、ggplot の結果を変数にバインドして print() を実行します。

plot <- ggplot(data = df) + ...
print(plot)

Screenshot

screenshot

※ スクリーンショットを載せます

以下の様に print() で囲んで実行します。

example4-5.r

##pdf("figure4-2.pdf")
         :
print(ggplot(data = df) + scale_shape_manual(name="Type", values=c(2,3,4)) + 
  geom_smooth(aes(x = population, y = mean)) +
  geom_point(aes(x  = population, y = mean, shape = "mean")) +
  geom_smooth(aes(x = population, y = median)) +
  geom_point(aes(x  = population, y = median, shape = "median")) +  
  geom_smooth(aes(x = population, y = max)) +
  geom_point(aes(x  = population, y = max, shape = "max")) +
  scale_y_continuous("queue size") +
  scale_x_continuous("population"))

もしくは、ggplot の結果を変数にバインドして print() を実行します。

plot <- ggplot(data = df) + ...
print(plot)

Screenshot

screenshot

ソース リンク
user9156
user9156
読み込んでいます