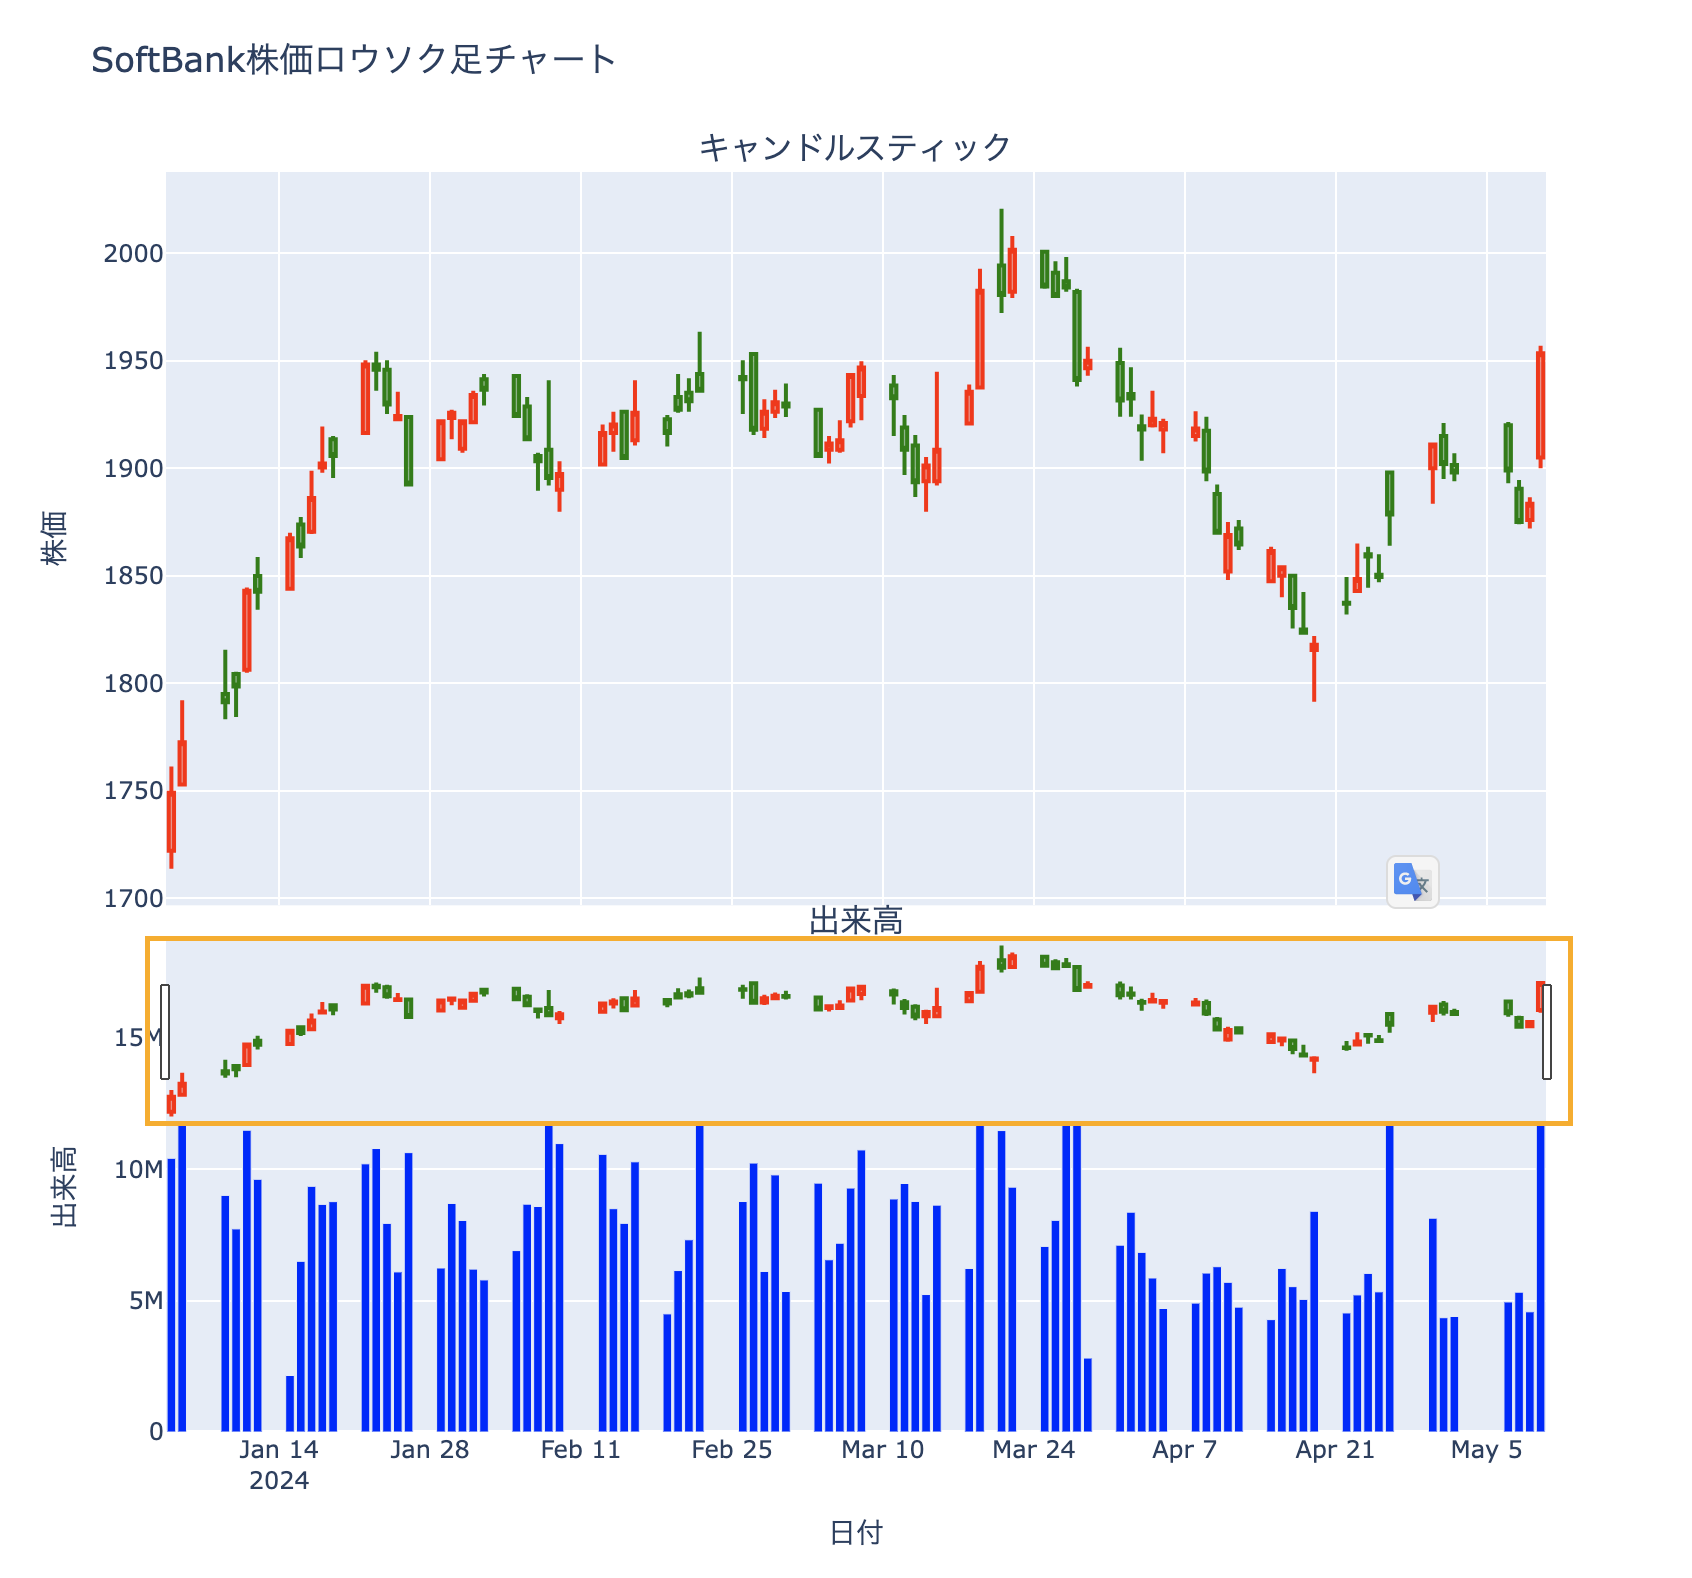
下記コードを実行するると添付図のようなグラフになります。この画像のオレンジ色の箇所を表示させたくないのですが可能ですか?
import datetime
import pandas as pd
import yfinance as yf
import plotly.express as px
import plotly.graph_objects as go
from plotly.subplots import make_subplots

class KabuGraph:
    def __init__(self, ticker, date_from):
        self.ticker = ticker
        self.date_from = date_from

    def get_data(self):
        print(f"ティッカー: {self.ticker}")
        print(f"開始日: {self.date_from}")
        hist = yf.Ticker(self.ticker).history(
            start=self.date_from,
            end=datetime.datetime.today().strftime("%Y-%m-%d")
        )
        hist = hist.round(2)
        hist.index = hist.index.date
        hist = hist.sort_index(ascending=False)
        hist.rename(columns={
            "Open" : "始値",
            "High" : "高値",
            "Low" : "安値",
            "Close" : "終値",
            "Volume" : "出来高",
            "Dividends" : "配当",
            "Stock Splits" : "株式分割",
            }, inplace=True)
        hist.reset_index(inplace=True)
        hist.rename(columns={"index" : "日付"}, inplace=True)
        hist["日付"] = pd.to_datetime(hist["日付"]) # queryをつかうのでto_datetimeを使う
        return hist

    def data_period(self, hist, begin=datetime.date(2024,1,1), end=None):
        if end is None:
            end = datetime.date.today()

        begin_str = pd.Timestamp(begin).strftime("%Y-%m-%d")
        end_str = pd.Timestamp(end).strftime("%Y-%m-%d")


        # df_period = hist[(hist["日付"] >= begin) & (hist["日付"] <= end)]
        # Using query method
        query_string = f"日付 >= '{begin}' and 日付 <= '{end}'"
        df_period = hist.query(query_string)
        return df_period

    def line_graph(self, hist):
        fig = px.line(hist, x="日付", y="終値", title="SoftBank株価推移")
        fig.show()

    def candlestick_graph(self, hist):
        # サブプロット付きのグラフを作成
        fig = make_subplots(rows = 2, cols = 1, shared_xaxes=True,
                            vertical_spacing = 0.03, subplot_titles=("キャンドルスティック","出来高"),
                            row_width = [0.2, 0.3]
        )

        # キャンドルスティックチャートを追加
        fig.add_trace(go.Candlestick(
            x = hist["日付"],
            open = hist["始値"],
            high = hist["高値"],
            low = hist["安値"],
            close = hist["終値"],
            increasing_line_color="red",
            decreasing_line_color="green"
        ), row = 1, col = 1)

        # 出来高の棒グラフを追加
        fig.add_trace(go.Bar(
            x = hist["日付"],
            y = hist["出来高"],
            marker_color = "blue"
        ), row = 2, col = 1)

        fig.update_layout(
                title="SoftBank株価ロウソク足チャート",
                # xaxis_title = "日付",
                yaxis_title = "株価",
                # xaxis_rangeslider_visible=False
                showlegend = False
         )
        # fig.update_xaxes(title_text="日付", row=1, col=1)  # 上段のプロット(キャンドルスティックチャート)の日付軸
        fig.update_yaxes(title_text="株価", row=1, col=1)  # 上段のプロット(キャンドルスティックチャート)の株価軸

        fig.update_xaxes(title_text="日付", row=2, col=1)  # 下段のプロット(出来高チャート)の日付軸
        fig.update_yaxes(title_text="出来高", row=2, col=1)  # 下段のプロット(出来高チャート)の出来高軸

        fig.show()


def main():
    date_from = "2020-01-01"
    kabu_graph = KabuGraph("9434.T", date_from)
    hist = kabu_graph.get_data()
    hist = kabu_graph.data_period(hist)
    # kabu_graph.line_graph(hist)
    kabu_graph.candlestick_graph(hist)
    print(hist)

if __name__ == "__main__":
    main()
