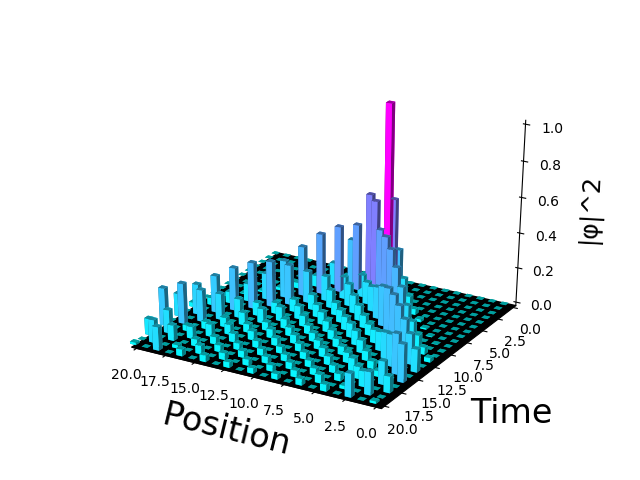
言葉で説明しにくく申し訳ないです。
以下の図のaxbar3dのxy平面上の水色の四角い図形の影を取り除きたいのですが、どのような対処を施せばよいのでしょうか?公式サイトにも自分が調べる限り載っておらず、stackoverflowの海外の方の似たような質問があったのですが、少し違く悩んでおります。
以下に見本のコードを掲載します。
import numpy as np
import matplotlib.pyplot as plt
import math
from mpl_toolkits.mplot3d import Axes3D
import matplotlib.animation as animation
import matplotlib.colors as colors
from matplotlib import cm


n=10
m=10
theta = 3*(math.pi)/12
p_spot=[]
P_spot=[]

P = [[np.cos(theta),np.sin(theta)],[0,0]]
Q = [[0,0],[np.sin(theta),-np.cos(theta)]]
x_list=[]
t_list=[]
p_list=[]
s_list=[]
a = 1/math.sqrt(2)
b = 1j/math.sqrt(2)
p_map=[]
pp_map =np.zeros([2*m+1,2*m+1])#,dtype="complex")
R=1/2
L=1/2
X_list=[]
P_list=[]

for j in range(0,2*n+1):
    if j  == n:
        phai = [a ,b]
        pro = 1
    else:
        phai = [0,0]
        pro =0
    p = np.dot(phai,np.conj(phai))

    x_list.append(j)
    X_list.append(j)
    s_list.append(phai)
    p_list.append(p)
    P_list.append(pro)


for t in range(0,2*m+1):
    t_list.append(t)
    if t ==0:
        s_list
        p_list
        P_list
    else:
        next_s_list = [0]*len(s_list)
        next_P_list = [0]*len(P_list) #listと同じ要素の数ですべて0を用意(初期化)
        for i in range(0,2*n+1):
            if i == 0:
                next_s_list[i] = np.dot(P, s_list[i+1])
                next_P_list[i] = P_list[i+1]*L
            elif i == 2*n:
                next_s_list[i] = np.dot(Q, s_list[i-1])
                next_P_list[i] = P_list[i-1]*R
            else:
                next_s_list[i] = np.dot(P, s_list[i+1]) + np.dot(Q, s_list[i-1])
                next_P_list[i] = P_list[i+1]*L + P_list[i-1]*R

            p_list[i] = np.dot(next_s_list[i],np.conj(next_s_list[i]))
            #pp_map[t]=p_list


        s_list = next_s_list
        P_list = next_P_list
    pp_map[t]=np.real(p_list)
    print(t,np.real(pp_map),np.real(p_list))


fig= plt.figure()
ax = Axes3D(fig, rect=(0.1,0.1,0.8,0.8)) #rect=(x0,y0,width,height)
X,Y = np.meshgrid(x_list, t_list)
ax.set_xlabel("Position",labelpad=10,fontsize=24)
ax.set_ylabel("Time",labelpad=20,fontsize=24)
ax.set_zlabel("|φ|^2",labelpad=10,fontsize=18)
ax.set_xlim(2*n,0)
ax.set_ylim(2*n,0)
ax.set_zlim(0,1)
offset = pp_map.ravel() + np.abs(pp_map.min())
fracs = offset.astype(float)/offset.max()
norm = colors.Normalize(fracs.min(), fracs.max())
clrs = cm.cool(norm(fracs))
ax.bar3d(X.ravel(), Y.ravel(), pp_map.ravel() ,0.5, 0.5, -pp_map.ravel(),color =clrs)
ax.w_xaxis.set_pane_color((0, 0, 0, 0))
ax.w_yaxis.set_pane_color((0, 0, 0, 0))
ax.w_zaxis.set_pane_color((0, 0, 0, 1))
ax.grid(color="white")
ax.grid(False)

plt.show()
