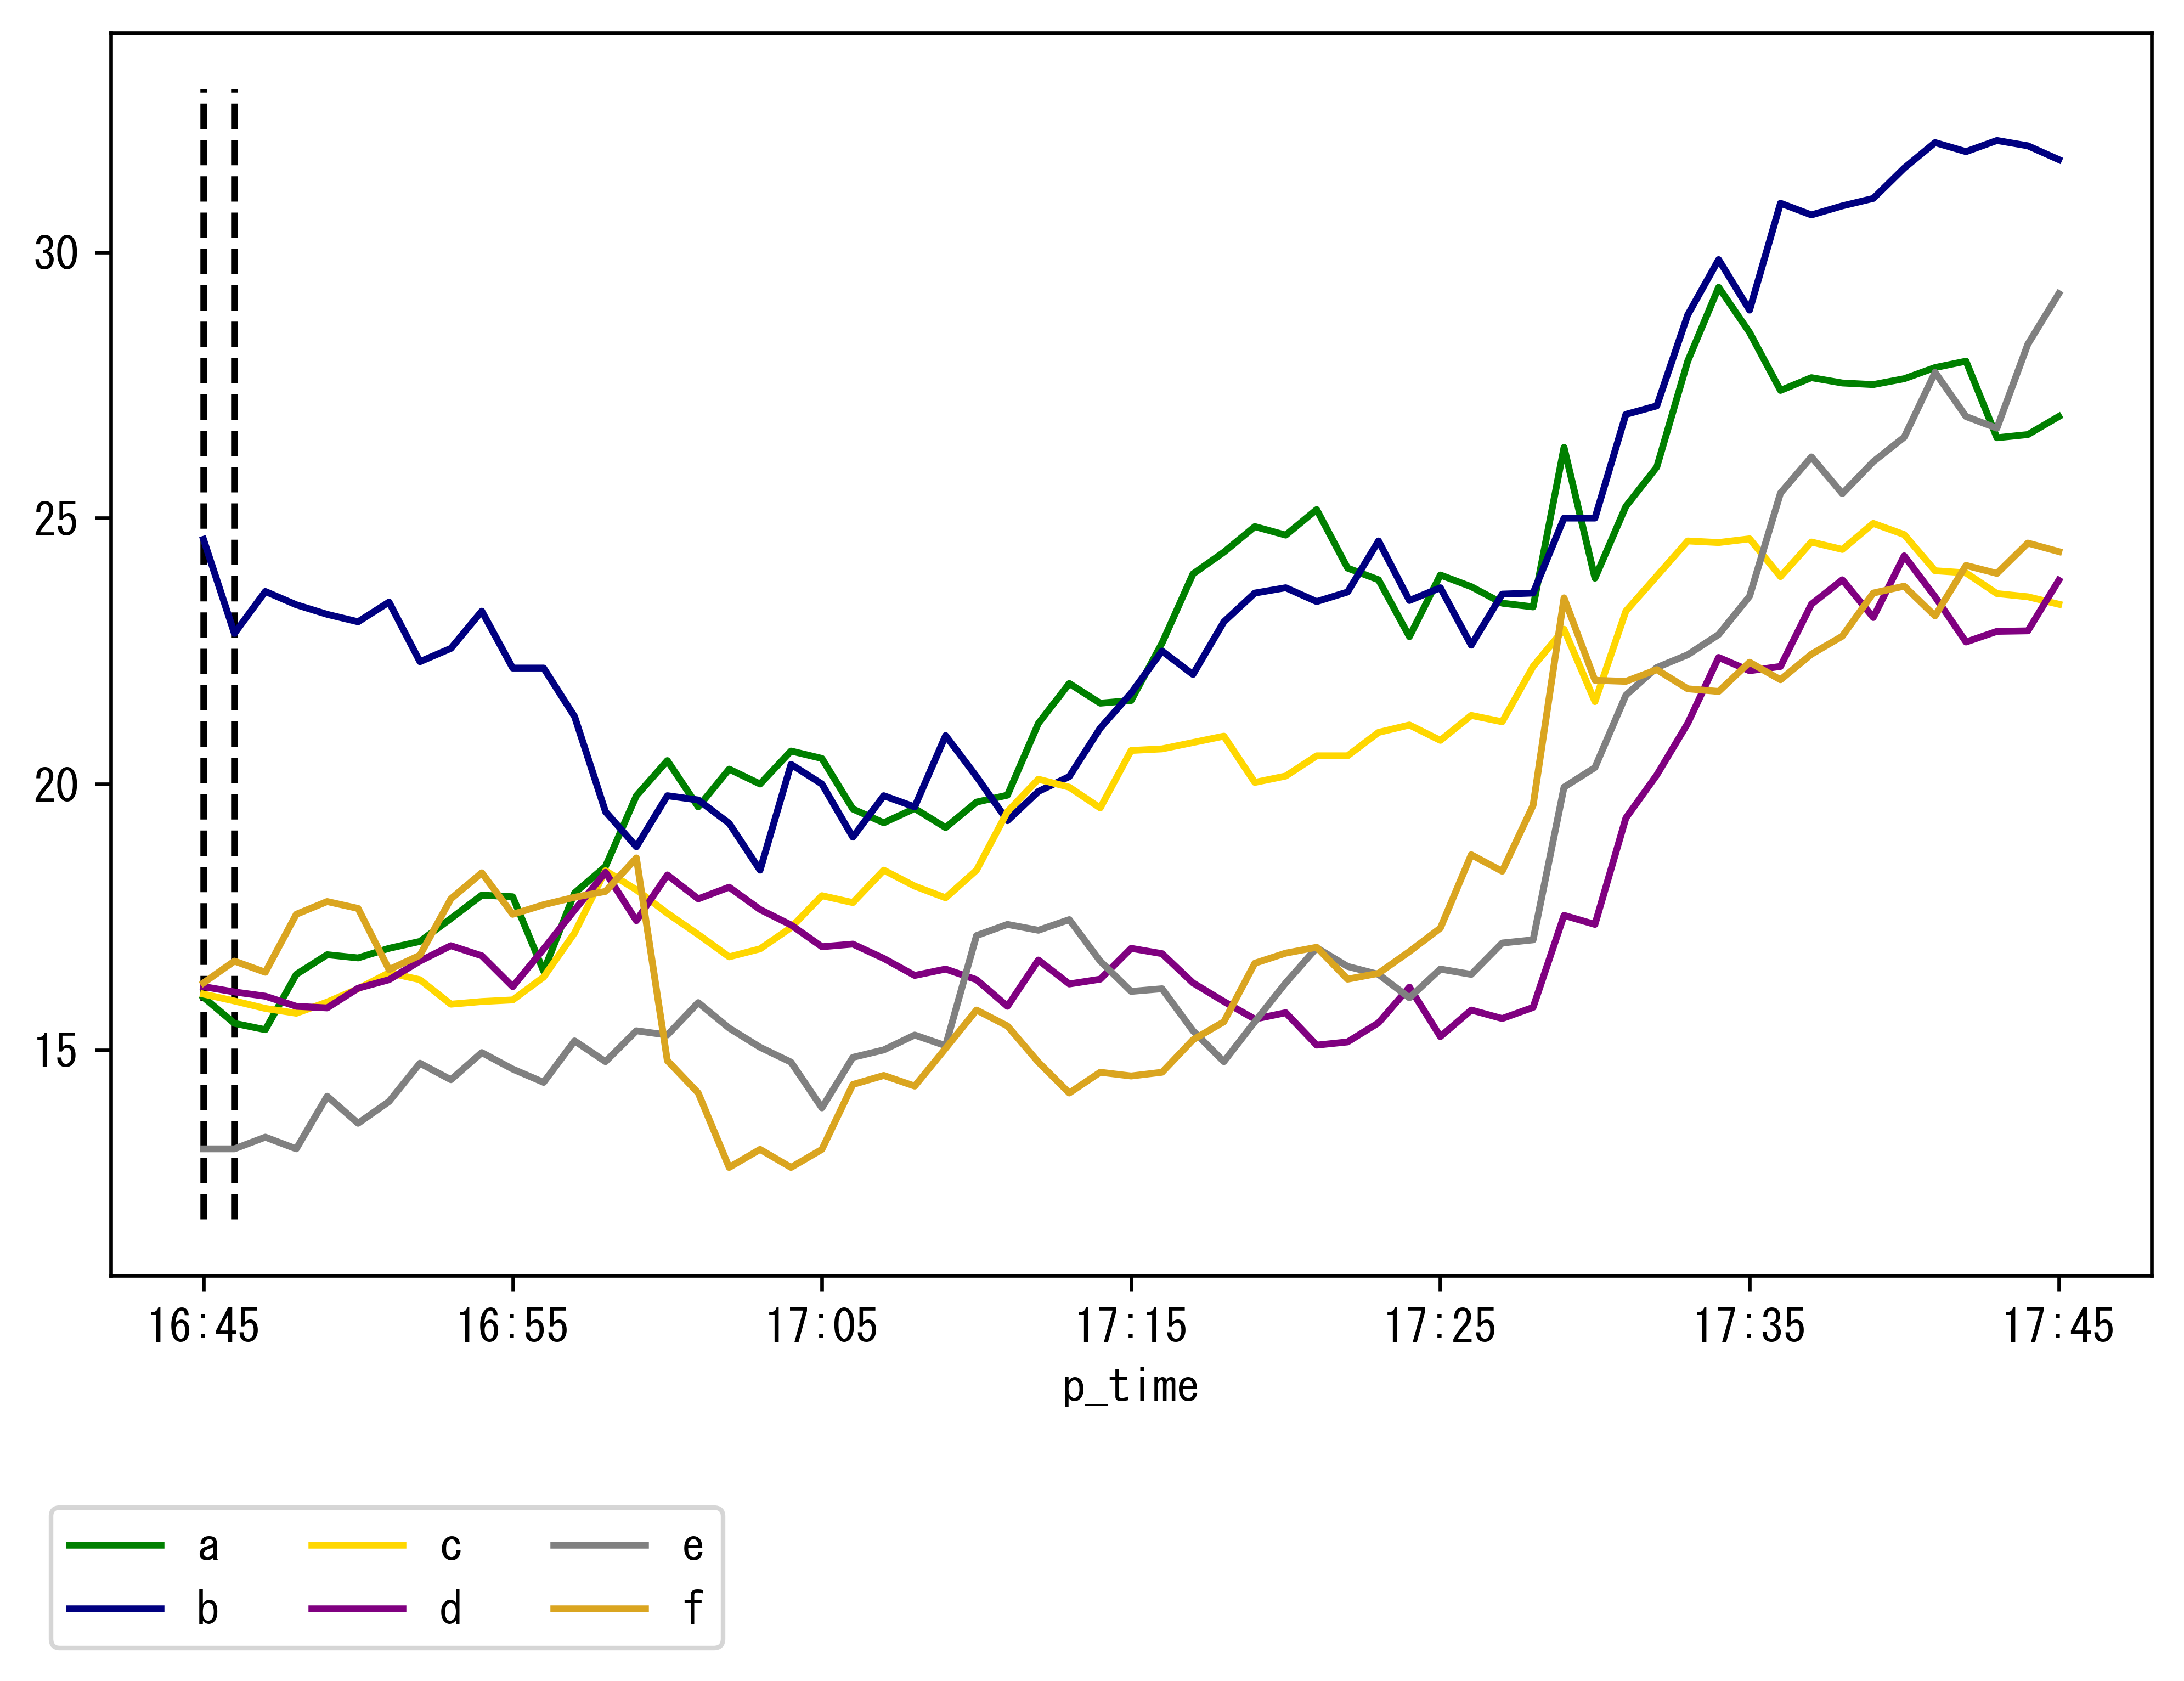
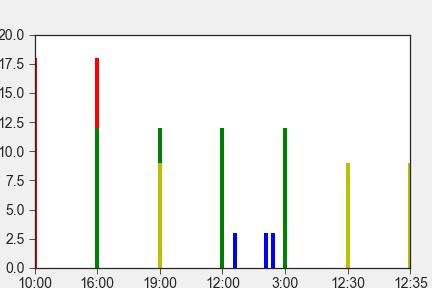
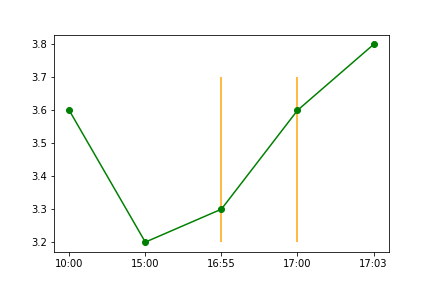
文字列のindexを持つpandas.Dataframeにおいて、縦の補助線を引く場合にindex(x軸)をうまく指定できないです。
plotしたいpandas.Dataframeは以下のようになります。indexがobjectなのは確認できています。
print(df_occ_test.index.dtype)

object

print(df_occ_test)

            a      b      c      d      e      f
p_time
16:45   15.99  24.60  16.05  16.19  13.14  16.26
16:46   15.50  22.83  15.92  16.09  13.14  16.67
16:47   15.38  23.62  15.78  16.01  13.36  16.46
16:48   16.42  23.37  15.69  15.82  13.14  17.55
16:49   16.79  23.19  15.90  15.79  14.13  17.79
16:50   16.73  23.05  16.15  16.16  13.62  17.66
16:51   16.91  23.42  16.45  16.32  14.03  16.51
16:52   17.04  22.30  16.32  16.67  14.75  16.78
                        .
                        .
                        .
as.vlinesで['17:00','17:30']を指定しても上手く機能しません。
ax = df_occ_test.plot(figsize=(8,5))

#縦の補助線
ax.vlines(['17:00','17:30'],ax.get_ylim()[0],ax.get_ylim()[1],colors='black',linestyles='dashed')

#凡例
ax.legend(loc="lower right", bbox_to_anchor=(0.3, -0.3,), borderaxespad=0,ncol=3)

plt.show()


