pythonとcsvファイルを用いて3次元グラフを作りたいです。
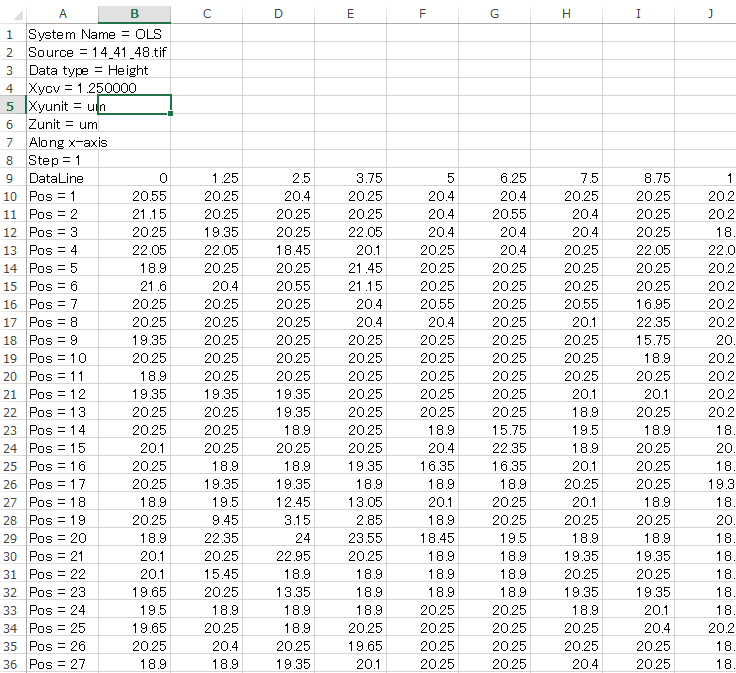
画像のようなCSVファイルを用いて三次元グラフを作ることを目標としています。(エクセルで開いているのでコンマの位置でセル分けされています。)
pos=768,列はAMKまで存在しています。
この画像中の9行目がx軸、A列がy軸に該当し、中のデータがz軸で表現される量に該当します。

また描画するcsvファイルの選択はパスを入力したいと考えています。
以上の事を考え、過去の質問などを参考に以下のようなコードを書いて試しました。
import pandas as pd
from mpl_toolkits.mplot3d import Axes3D
import matplotlib.pyplot as plt
import numpy as np


# CSVからデータを読み込む#  CSV読み込み
# CSVのパスを取得
filepath = input(r"ファイルのPathを入力してください:(例)C:\User\Desktop\data.csv")
data = pd.read_csv(filepath , header=8 , index_col=0)

print(data)
print(data.index)
print(data.columns)

# 3Dグラフの初期化
fig = plt.figure()
ax = fig.gca(projection='3d')

# データの準備
Xgrid = data.columns
Ygrid = data.index
X, Y = np.meshgrid(Xgrid, Ygrid)
Z = data.as_matrix()

# プロット
surf = ax.plot_surface(X, Y, Z)

# 表示
plt.show()
すると以下のようなエラーメッセージが表示されました。
しかし、具体的に何を指摘されていて、何をどう直せばいいかわからないため教えていただきたいです。
どのようにすればグラフを作れるのでしょうか。
Warning (from warnings module):
  File "C:/Users/pierrot/Desktop/csv加工.py", line 19
    ax = fig.gca(projection='3d')
MatplotlibDeprecationWarning: Calling gca() with keyword arguments was deprecated in Matplotlib 3.4. Starting two minor releases later, gca() will take no keyword arguments. The gca() function should only be used to get the current axes, or if no axes exist, create new axes with default keyword arguments. To create a new axes with non-default arguments, use plt.axes() or plt.subplot().
Traceback (most recent call last):
  File "C:/Users/pierrot/Desktop/csv加工.py", line 25, in <module>
    Z = data.as_matrix()
  File "C:\Users\pierrot\AppData\Local\Programs\Python\Python39\lib\site-packages\pandas\core\generic.py", line 5487, in __getattr__
    return object.__getattribute__(self, name)
AttributeError: 'DataFrame' object has no attribute 'as_matrix'
>>>
DataFrame.values()instead."