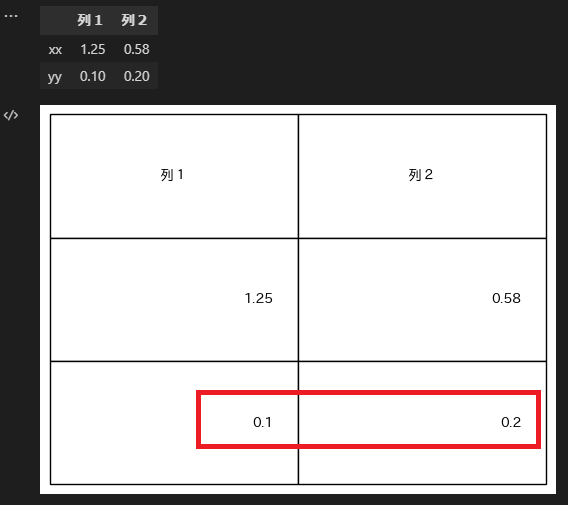
以下のサイトを参考に、matplotlibで、PandasのDataFrameを、画像に保存下のですが、
小数点以下の桁数をフォーマット指定することができず困っています。
小数点以下、2桁で表示する方法を教えていただけないでしょうか。
参考にしたサイト:https://tedukapm.tech/python/tableoutput/
import matplotlib.pyplot as plt
import pandas as pd

df = pd.DataFrame(
    data=[
        {'列1': 1.25, '列2': 0.58},
        {'列1': 0.10, '列2': 0.20}  # ←ゼロ埋めして、小数点以下2桁で表示させたい。
    ],
    index=['xx', 'yy']
)
df.style.set_precision(2)
df.style.format('{:.2%}', na_rep='-')
display(df)

fig, ax = plt.subplots()  # 単位はインチ
ax.axis('off')
ax.axis('tight')

arg_map = {
    'cellText': df.values,
    'colLabels': df.columns,
    'loc': 'center',
    'bbox': [0, 0, 1, 1],
}
table = ax.table(**arg_map)
plt.savefig('image.png')
以下、実行結果です。
上段はdisplay(df)の結果。下段はplt.savefig(...)の結果が表示されています。
下段の2行目の値も小数点以下2桁で表示させたいです。(列ごとにフォーマット指定できればなお良しです。)
